Controllers Council recently held a webinar on 2023 Economic Outlook, sponsored by Allianz Trade.
Our speaker, Dan North, is a Senior Economist North America for Allianz Trade. He’s been with Allianz since 1996, and he’s used macroeconomic analysis to help manage Allianz’s risk portfolio of more than 150 billion in annual US trade transactions. He’s appeared on CNBC, Fox Business News, Bloomberg Radio, and Television. And quoted by Business Week, the Financial Times, NBC, the BBC, the New York Times, and the Wall Street Journal. After having predicted the 2008 and 2009 recession and its implications accurately, Dan was ranked fourth on Bloomberg’s list of top economic forecasters in 2010. Dan holds an MBA from the Wharton School of Business.
Following are key takeaways to this discussion. If you are interested in learning more, view the full webinar archive video here.
Positives in the US
The labor market is still strong: when we shut down the economy, we lost 22 million jobs. Then, we regained a lot of the jobs, and since then, on average, we’ve regained 500,000 jobs a month. But keep in mind that when you lose 22 million jobs, we haven’t barely created any new jobs. We basically have recovered all those jobs that were temporarily lost. So, the next time you hear someone say, “200,000 jobs created last month, that’s terrific.” Take it with a grain of salt.
Participation rates going back up: unemployment rate at 3.5% near a 50 year low. The unemployment rate, you must understand what it is. What it is, you’re defined as unemployed if you’re looking for a job and you don’t have one yet. If you’re not looking for a job, you’re said to be not participating. You’re not in the unemployment rate calculation. So, you’re going to have very low unemployment rate, and still have a very low participation rate.
High frequency indicators: people aren’t spending a lot with credit cards. TSA throughput is pretty much back where it was. Hotel occupancy is above that pre-pandemic level, but I would call it uninspiring. So, we haven’t seen really a whole lot of recovery there.
Now let’s talk about the negatives in the US…
Inflation
inflation is the top of the list. I want to show you how this inflation was created, because it’s very important understanding how it’s going to be overcome.
And there was some inflation created by supply chain disruptions, shortage in the labor force. But mostly, it was caused by the Federal Reserve, which controls monetary policy.
That’s the chart over on the left. The Federal Reserve has two tools to control monetary policy. The first is that blue line. That’s the overnight Fed Funds rate. You hear a lot of people say, and I say it too, that the Fed’s raising interest rates. Really, they only control the one rate, the overnight Fed Funds rate. But it influences all the other ones. So, you can look back in the ’80s, ’90s, and see that the Fed Funds rate was up in the high teens. And then it came down in the ’90s and the 2000s. And then the Great Recession came along and the global financial crisis. And the Fed Funds rate was set to zero. Never been done before. These were emergency conditions. It was a tough time. Set to zero.
And you can see the tan area there is what we call the balance sheet. Balance sheet is just the amount of money the Federal Reserve is making available to the economy to keep liquidity flowing, credit flowing, making loans, all the way down to individuals.
Now if you look carefully on this chart over here on the left, the balance sheet was never used as a tool before. It just kind of grew along with the economy. And then again, suddenly in the Great Recession, it was blown up again to provide all that liquidity. So, you had those emergency conditions in there.
And then things kind of turned back to normal a little bit. But then COVID came along. And appropriately, the Fed reserves set interest rates to zero again, and exploded the balance sheet. Making sure there was so much credit and liquidity, that everything would keep flowing.
But by the time they got around to raising the Fed Funds rate, they were desperately behind the curve.
And remember finally, the big risk. Number four there is when a central bank raises rates to slow inflation, it’s deliberately trying to slow the economy as well. And it works. That’s the risk. It was the Federal Reserve in my belief that caused most of the inflation. And on the right, yeah. There was this $5 trillion of fiscal stimulus, and that was probably too much. And that certainly fanned the fires of inflation as well. But in my opinion, it was more the Federal Reserve. Too much easy money for too long.
So, we did get inflation. We got this consumer price inflation there over on the left. Hit a 40 year high of 9.1% back in June of this year. I mean, look how sharply it rose. Well, it’s come back down to 6.5% year over year now. That’s good. It’s less. But it doesn’t mean prices are going down. In fact, it means that prices are still going up, only at a slower rate. Still 6.5% year over year, and that’s a lot.
Recessions
Now when the Fed reserve tightens rates like that, raises rates that rapidly, it does something called inverting the yield curve. And that’s a very strong signal of a recession coming soon.
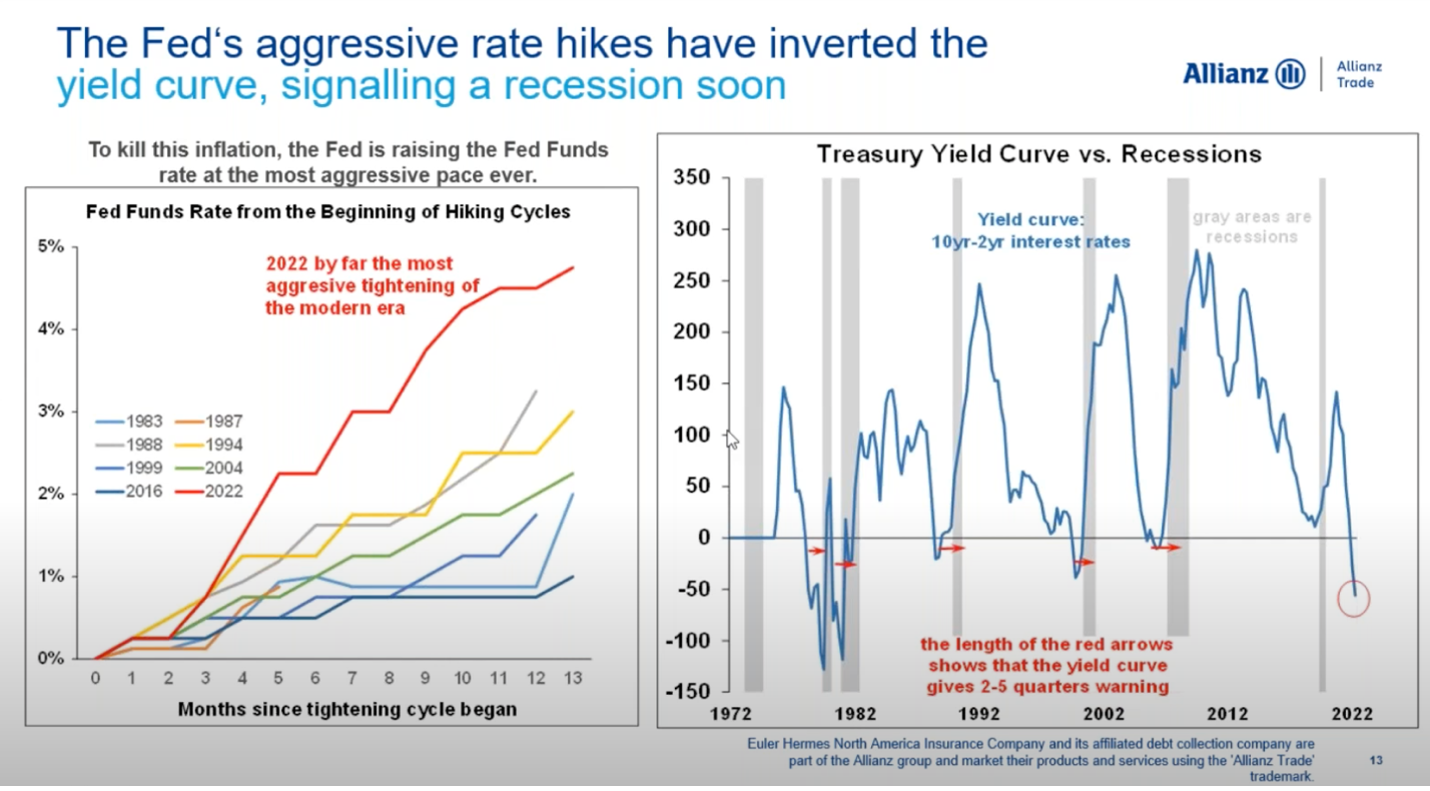
But occasionally, like now, the Federal Reserve starts jacking up short-term rates to the point that they become higher than long-term rates. And that gap goes negative. That blue line goes negative. Every time it does, it’s followed by a recession. So, if you look at the chart over here on the left, you see that in the late ’70s, the blue line went negative, followed by a recession in there. The gray columns. That’s a little bit of a hard example to see.
But then in the early ’80s, the blue line went negative and there’s a recession. Same things in the ’90s, the 2000s when we had the tech bubble burst. In the Great Recession, the blue line went negative, followed by a recession. The red circle indicts where we are today.
Housing Market
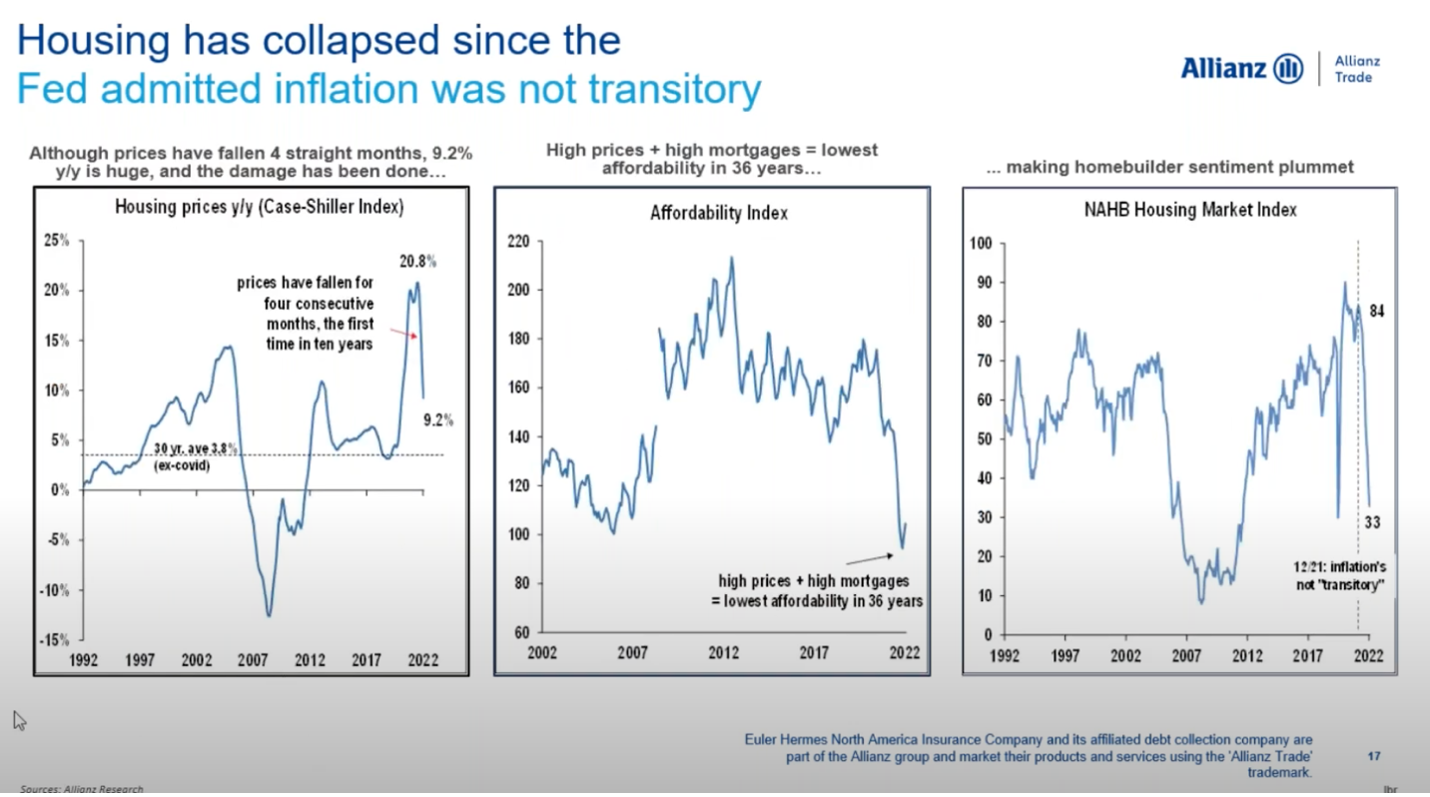
There has been an unsustainable growth in housing prices compared to wages. And that might make you think that perhaps that could be a bubble. The housing market has been the first victim of the Federal Reserve’s actions, perhaps other than the financial markets. When the Federal Reserve came out and said, “Yeah, I guess the inflation’s not transitory.” That’s where they did that. At that point, the blue line, the 30-year mortgage, went from 3% to about 7%. And over that time period, new home sales, the brown line plummeted 25%. Existing home sales plummeted as well. Housing market taking a beating. Was at 20.8% year over year, but then fell four consecutive months. So, the first time it’s happened in 10 years and is down at 9.2%. But again, a long way to go yet. So, you combine what those are still high housing prices, with those high mortgage rates.
Labor Market
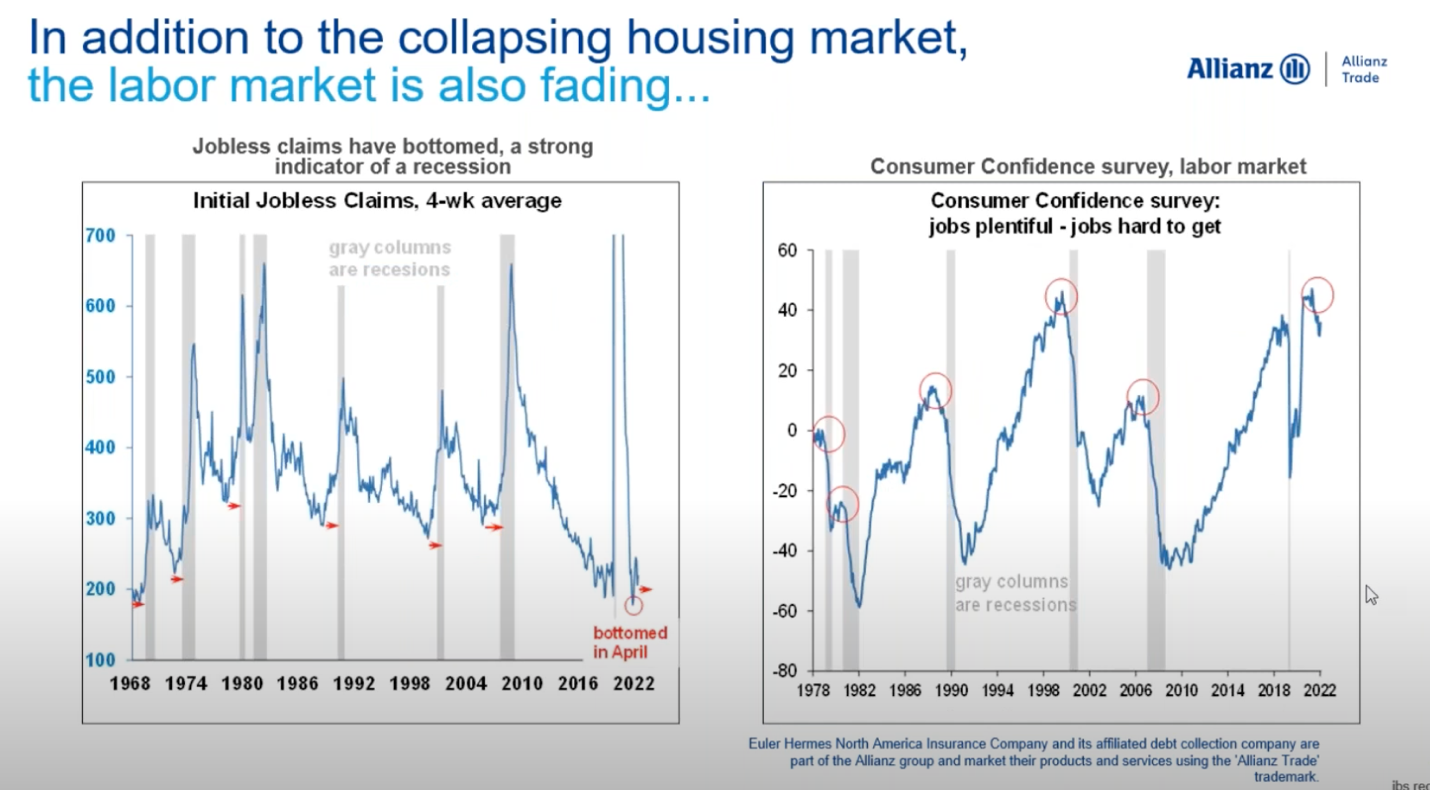
The labor market is also softening up. And here’s where I’m a bit out of consensus, because everybody’s looking at that 200,000 number of jobs gained every month.
Job postings on Indeed on July 8th of last year was at 83% compared to February 1st of 2020. In other words, compared to normal times. It was at 83% there. And the course of a few months, it was down at 57%. So clearly, you’re seeing deterioration there.
Another measure is jobless claims. This is a case where somebody is out of work because the business, they work for failed, or they quit, or they got fired. And they go into unemployment office and says, “Hey, I’m out of work. I need my unemployment benefits.” That’s what that blue line is. And you can see again, it’s a perfect indicator of an oncoming recession.
Now, another final measure here of the softness in the labor market is going back to that consumer confidence survey. And they ask people, “Are jobs plentiful?” And they also ask, “Are jobs hard to get?”
Now in good times, jobs are plentiful. So, this measure goes up. Jobs are plentiful. And there are few people saying jobs are hard to get. This is in good times. But once that measure peaks, it means suddenly people are saying, “Well, jobs aren’t as plentiful as they used to be. They’re a little harder to get.” Once that peaks, guess what? Going on a recession again, you can see it every time it happens when the blue line peaks.
To view the complete webcast, download full webinar here.
ABOUT THE SPONSOR:
Allianz Trade is a global leader in trade credit insurance, and your partner for trade risk insights and cash flow protection. Allianz Trade can help predict trade and credit risks and protect your cash flow. Backed by Allianz, with more than 125 years of expertise. Allianz trade global business intelligence is unrivaled, using technology driven processes to generate insights and present actionable information to businesses of all sizes and in all sectors.


